
Network Bandwidth Monitoring Software
Detailed network traffic bandwidth specs of your network traffic, so you can monitor and deliver maximum availability for critical applications.
Check Your Network Bandwidth
Entuity™ real-time network bandwidth monitoring software facilitates your network visibility and shows who’s talking to whom, at what intervals, for how long, using which ports and protocols, and how much data is exchanged. With a top-down perspective of your network that can scale with ease to any network size, the network bandwidth analyzer helps you reduce Mean Time to Restore Service (MTRS) and Mean Time to Repair (MTTR) across your network (or your customer’s).
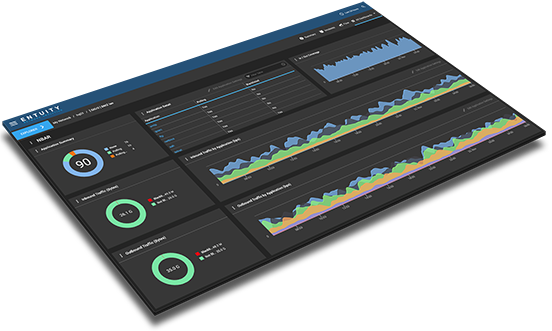
Prepare for future growth by shedding light on the interfaces that see the most and least use with the network flow analyzer. With Entuity’s flexible and customizable dashboard, the network bandwidth monitoring tools present both flow- and element-based perspectives in context.
What can you identify with the network bandwidth tool?
- Identify High Bandwidth Application Consumption
- Identify Network Congestion
- Identify Destinations of your Network Traffic
Recognized as Network Monitoring Leader by G2
How Entuity Compares to Other Network Bandwidth Monitoring Software Tools
Stop Fighting Network Bandwidth Issues
-
Provide bandwidth for critical business applications
Observe longitudinal traffic patterns in increments as precise as 1 minute so you can determine exactly which protocols and traffic classes are experiencing bandwidth starvation. Monitor which end users are causing bottlenecks or which types of traffic are the most resource-hungry and probable to contribute to network congestion so that you can respond in kind to keep crucial business services up. Move ahead with confidence by determining bandwidth patterns to facilitate better capacity planning.
-
Monitor traffic between subnets and cloud applications
As cloud computing becomes more popular, your need to understand the cumulative effects of a mass of workstations in specific locations (e.g. departments, offices, subnets) that communicate with applications on public/private cloud environments grows. IFAP gives you immediate access to bandwidth patterns and historic trends for specific subsets of traffic, so you can determine where the network meets availability and performance requirements.
-
Gauge network impacts on business services
Networks are increasingly distributed, with a massive amount of endpoints. You must know from where your traffic is coming and going. Use network bandwidth monitoring software to understand which business services are supported by the different links in your network. Keeping a record of where your bandwidth stands allows you to prioritize allocation of resources for precise troubleshooting and proactive management.
Larger networks are also increasingly difficult to defend from external attacks. IFAP can help you detect potential DoS attacks by identifying abnormal network bandwidth behavior within your network. Networks are holistic systems – when one aspect faces an issue, there will be consequences elsewhere. Entuity network path monitoring allows you to easily keep an eye on how the network affects traffic flow and vice versa.
-
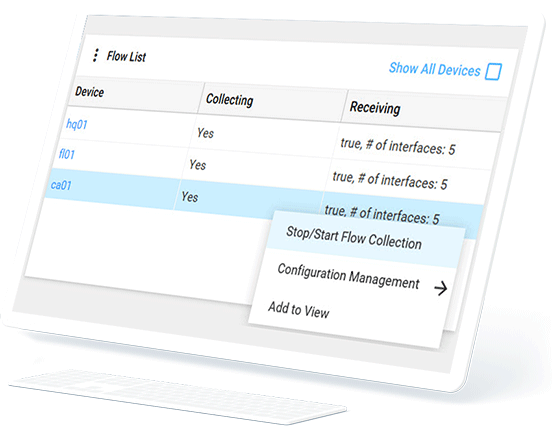
Configuration Made Easy
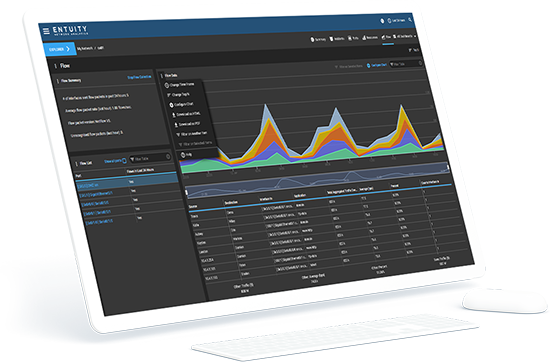
You have total control over the collection of bandwidth data, and we’ve consolidated flow configuration and management into a simple process that matches the flexible and accessible nature of Entuity. It’s easy to enable or disable flow collection through the Flow Inventory page, from specific flow dashlets, or the Context Menu of the selected device. Manage all network flow collection from the Flow Inventory page, providing you with an overview of all devices configured for flow and insight into the flow data on all configured devices and ports.
Assign as many flow collectors to Entuity servers as its license permits, and deploy additional servers to seamlessly handle large volumes of collection or when traffic must be localized geographically. Gain complete visibility of which flow collectors are assigned to which server or servers, and of the devices associated with each collector, all without administrative burden.
Your Bandwidth, Your Way
-
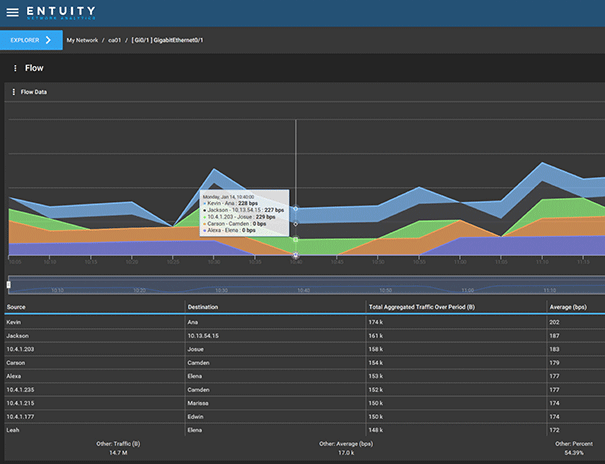
Flow Data Dashlet
The Flow Data dashlet displays flow data in chart and table form for the selected View, device, VM platform or port.
-
Flow-Enabled Devices
The Flow-Enabled Devices dashlet lists the devices or ports on the selected managed object that are enabled for flow. Use this dashlet to start or stop flow collection on a selected device.
-
Flow Summary
The Flow Summary dashlet displays a summary of flow data for the selected device. Use this dashlet to start or stop flow collection on the selected device.
-
Flow TopN Summary
The Flow TopN Summary dashlet displays topN information for flow-enabled devices.
Enterprise Bandwidth Management Tools
Entuity network management software ties together all aspects of flow and bandwidth management – information on network congestion, the destination of network traffic, applications consuming high bandwidth percentages – as part of your wider enterprise network management, monitoring and analytics software.
- Remote Server Flow Collection: Network Flow collection is aggregated into a simple process – collect flow from a local collector, and manage collection from remote servers.
- Real-Time Granularity: Real-time visibility into top bandwidth usage, so you can identify hosts with suspiciously high numbers of active conversations with granularity of 1 minute.
- Adjustable Data Retention: Retain your data for longer than just a month. Store years of consolidated data, dependent only on memory size and get detailed reports down to a granularity of one minute.
- Custom Data Analysis: View flow data in the way that best suits your process, with combinations of eleven breakdowns: conversations, interfaces, applications, ports, hosts, listeners, talkers, protocols, QoS classes, DSCP classes, IP precedence classes.