
eBook – 8 Common Network Problems You Can Solve With Entuity
Entuity Software

8 Common Network Problems You Can Solve With Entuity
Table of contents
Excessive event noise • Isolated latency and performance problems • Inexplicable high bandwidth utilization • Frequent unforeseen side effects due to network changes • Each user needs different information • Undue time and resources spent on network documentation • Lack of visibility into port capacity • Difficulty prioritizing the most pressing network issues
Every day, Entuity customers face common network problems that in many cases have an easy but not always obvious solution. In fact, our support team often receives questions related to the very issues we have summarized in this eBook.
All our customers should have accessible resources at their fingertips which allow them to answer such questions quickly and completely. Our online support center offers a great deal of documentation, but Entuity has a lot of capabilities that solve rather specific situations our customers face routinely. Here is a helpful collection of eight common network problems Entuity can solve to assist you in addressing these problems with ease, perhaps in ways you have not considered before.
- Excessive event noise
- Isolated latency and performance problems
- Inexplicable high bandwidth utilization
- Frequent unforeseen side effects due to network changes
- Each user needs different information
- Undue time and resources spent on network documentation
- Lack of visibility into port capacity
- Difficulty prioritizing the most pressing network issues
#1 Excessive event noise
Symptoms:
“I never know what’s important and what’s not.”
“My network management system is overwhelming me with alerts.”
Solution:
Root cause reduction of event noise
There are multiple approaches you can take using Entuity for eliminating disruptive “noise alerts” and revealing the alerts that really matter. First, it is important to recognize there is often a conflict of incidents being displayed. By applying Entuity’s root cause analysis approach, you can avoid being overwhelmed with event noise and eliminate downstream outage alerts for an outage with downstream consequences.
For example: It is entirely possible to find yourself in a scenario whereby you are observing what seem to be 39 different failed pieces of equipment on your network, when in reality there is a single failure blocking access to the other 38, which are not responsible for the outage.
Root cause reduction of event noise allows you to distinguish between the symptom and the real outage automatically.
Entuity includes flapping detection with suppression to eliminate repeated alerts to flapping conditions, such as a port flapping up and down, for instance. You can also enable hold off rules to eliminate and/or flatten spikes for threshold crossings, allowing you to delay alerts until the severity of a specific problem qualifies. To identify anomalies rather than just a simple threshold crossing, employ a dynamic threshold.
Downstream symptomatic outages which have a root cause failure can be automatically eliminated, allowing the network team to focus on the problem at hand rather than becoming consumed by its consequences.
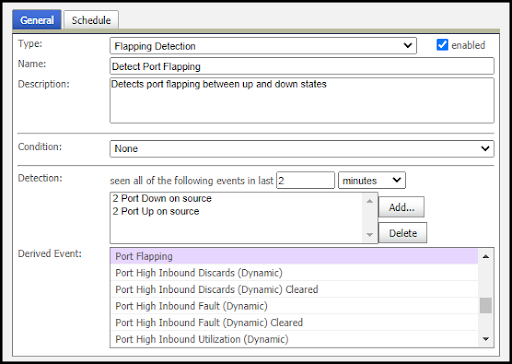
Figure 1. Event management system rule detects port flapping
#2 Isolated latency and performance problems
Symptom:
“One of our offices is reporting slowness accessing resources in the data center, as well as poor performance from applications hosted in the data center, but no one else is complaining.”
Solution:
SurePath
When scenarios such as this arise, SurePath can be used to monitor from the perspective of multiple locations across the network that have access to key application servers in the data center or in the cloud. You can raise alerts when responsiveness on the network drops below an acceptable level.
For example: SurePath can classify addresses as being required or blacklisted, which allows alerting on metrics other than latency and reachability.
Further, you can use historic viewing to visualize multiple routes taken at different times to determine whether there is a routing change and where the problem is being introduced. Understanding the routes being taken between a client and a server is critical when trying to identify performance problems in different parts of the network. If you don’t know through which devices and interfaces your data is being carried, you don’t know where to look for problems. When a performance problem is intermittent, knowledge of which routes are being taken at different times can reveal problems in a route that might not be in use at the time the analysis is being performed.
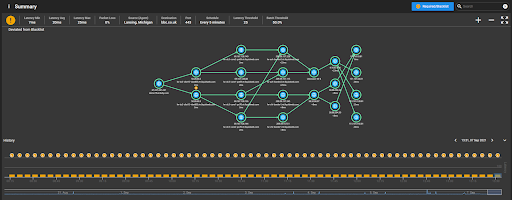
Figure 2. SurePath showing an alert for a blacklisted address
#3 Inexplicable high bandwidth utilization
Symptom:
“A link between offices is reporting high utilization at critical times of the day but I cannot identify a reason for the saturation. I’m wondering whether I should invest in a circuit bandwidth upgrade or if there’s a way to look at this more intelligently.”
Solution:
NetFlow
It is possible to evaluate excessive utilization scenarios such as this more intelligently using NetFlow, which allows you to uncover significant conversations happening between different hosts across a circuit over time. From there, you can identify which applications are being used by and between which hosts, enabling you to make more informed decisions as to whether those applications should be saturating the network at that time or whether the traffic should have been on the link at all.
For example: One Entuity customer was using an inordinate amount of bandwidth, causing network performance to suffer, but was unable to figure out why. After implementing network flow analysis using NetFlow, they discovered they were running a centralized antivirus solution on a server in their headquarters, misconfigured to download updates to every single client over the Internet on a regular basis. After the misconfiguration was corrected, they were able to reduce bandwidth utilization for their Internet circuits and free up capacity, eliminating the need to order additional bandwidth from their service provider.
It is entirely possible that a misconfiguration, unknown failure, or even employee misuse (deliberate or accidental) could be causing saturation. It is also possible that an intended transfer over the link, such as a database synchronization, is the culprit, but was simply conducted at the wrong time due to a scheduling error. When you know the cause and its characteristics, you will be in a better position to rectify the problem. While SNMP monitoring is the standard, it does not provide the necessary depth of understanding that NetFlow does for identifying problems such as this.
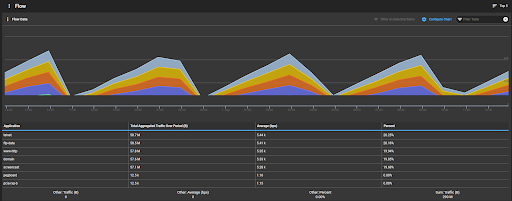
Figure 3. Flow graph showing distribution of application traffic
#4 Frequent unforeseen side effects due to network changes
Symptom:
“Users are opening help desk tickets complaining of slowness on company applications that are hosted in Amazon Web Services.”
Solution:
Configuration monitoring
Configuration monitoring allows you to back up and alert on configuration changes, providing an extra layer of alerting in the event that a change causes problems or unforeseen side effects in the network, regardless of whether it was authorized. Entuity retains backup copies, allowing you to see what change was made and the resulting difference. This enables you to correlate reports of problems with the time during which changes were made to identify which one introduced a problem.
For example: Consider a scenario wherein a network engineer makes changes to the company’s main Internet-facing router, which causes all traffic destined for the Internet to go over the company’s backup link to the Internet. This particular link has much lower bandwidth than the primary link, causing a major problem with employee productivity.
When configuration changes are made, Entuity alerts if those changes violate specified policy rules. Simply configure policy rules such that when the configuration is backed up, it is compared to the policy rules; if the rule is violated, an alert is generated.
In general, it is a standard best practice to back up network device configurations when changes are applied. If there is a need to replace hardware, the configuration can be used to restore the original working condition without having to recreate it from scratch.
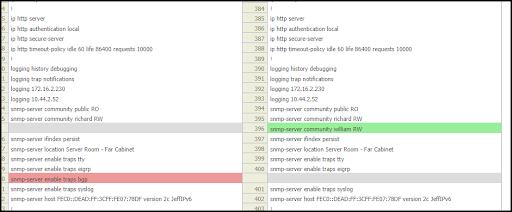
Figure 4. Web tool showing comparison of device configurations and highlighting differences
#5 Each user needs different information
Symptom:
“Different groups of users like our Network Operations Center (NOC) staff and departmental managers have vastly different needs for information.”
Solution:
Customizable dashboards
Entuity offers customizable dashboards, allowing you to create collections of pertinent information that matters to different user communities in your environment. This allows you to tailor the user experience according to the role of the user.
For example: Your NOC engineers probably need to focus on anomalies and outages, whereas a departmental manager will probably be more interested in looking at business service levels.
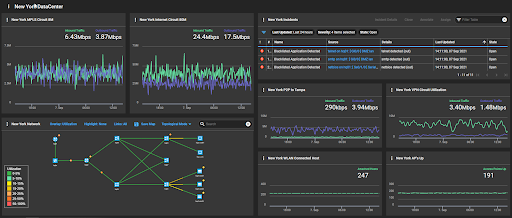
Figure 5. NOC view dashboard for New York data center
#6 Excessive time and resources spent on network documentation
Symptom:
“I’m expected to keep and update schematics of all the different networks in my organization and it’s a never-ending task.”
“I would have a lot more time to do meaningful network assignments if maintaining network documentation were not so time consuming.”
Solution:
Topological mapping
Entuity’s topological map reduces the manual effort of maintaining network documentation through auto discovery, as well as continuously updating itself as the network changes. Use topological mapping to discover equipment in the network, as well as how it is configured and interconnected. This information is automatically maintained over time as the network changes. Without appropriate automation, unless you are keeping up to date with network changes diligently, the accuracy of results from the network management system would be suspect.
For example: A global corporation has over 500 locations worldwide and each of these has network devices. A network engineer has the responsibility of ensuring that the topology diagrams and asset information in all these locations is up to date.
This information allows the preparation of network schematics in the form of a topology map, which can be exported directly into Microsoft Visio with all relevant information, including details of devices and the interconnections between them. Some changes may be necessary according to your preferences, but the work is minimal compared to entering the information by hand.
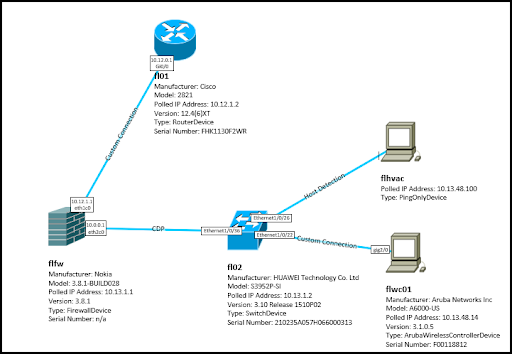
Figure 6. Visio export of site showing connections and asset information
#7 Lack of visibility into port capacity
Symptom:
“I know there must be many access switch ports not being used, but I’m not sure how many or where surplus capacity is located.”
Solution:
Port analysis
The port availability tool analyzes physical ports and identifies which are spare, resulting in an accurate measure of available network capacity or lack thereof. It is common to overlook this sort of information, however, if you can identify and accurately catalog spare capacity, it can save significant expense.
For example: Consider an Entuity customer who was preparing to purchase a sizeable amount of equipment from a large vendor, but their purchase order seemed unnecessarily bloated. After running an analysis, they determined they had not properly accounted for spare capacity and were able to use what they already had more efficiently allowing them to reduce the quantity of newly purchased equipment. This resulted in immediate and significant ROI.
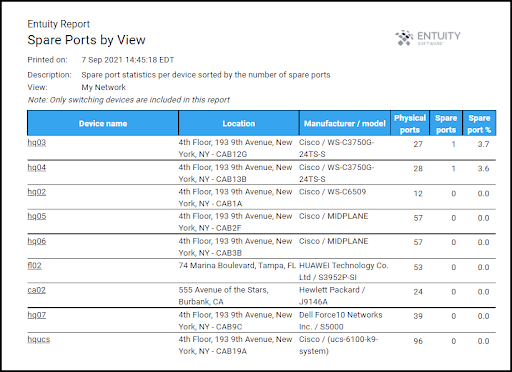
Figure 7. Spare Ports by View report showing all spare switch port capacity
#8 Difficulty prioritizing the most pressing network issues
Symptom:
“Based on various alerts, I know I have problems in my network, but I am not sure which problems should be prioritized because I don’t know which ones are causing the most pain.”
Solution:
Service modeling
Service modeling allows you to define which devices, components, circuits, and servers are relevant to each business service, uncovering which services are mostly likely to be impacted when components report problems. Basically, this function establishes whether there is interdependency or redundancy between components which could allow for outages that do not impact users.
Correlating problems to the services they are impacting puts you in a significantly better position to identify where you should focus your effort.
For example: Consider standard monitoring systems. If you lose communication to a network device due to a network outage, you know the device is down. When you place that device and other devices, ports, and objects into a service model, if that component fails and there is a network outage, it alerts on the business service itself and identifies the component as failed or indicative of a problem. This makes it clear where the impact would be expected to be felt.
Service modeling can range from straightforward to complex. Some customers, for instance, choose to model redundant components in individual pieces of network gear. In this scenario, if a system has three power supplies and one fails, services will not go down, but are impacted or degraded, which allows for proactivity. The service continues to operate normally without impacting end users, but the network team is aware of the problem and can address it before it becomes an outage.
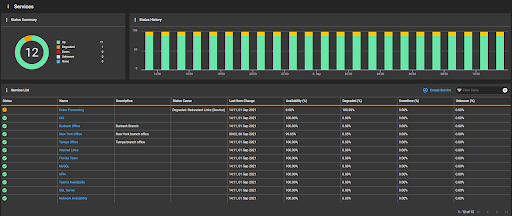
Figure 8. Services Summary Dashboard