

Network Monitoring and Observability with Entuity Software™
Comprehensive, automated monitoring, visualization, and across your entire network.
Network Monitoring Experience
Entuity provides comprehensive, vendor-agnostic network monitoring to discover and map devices automatically—including switches, routers, and firewalls—and visualize your entire estate. It offers real-time performance metrics, intelligent alerting to reduce noise, and configuration management for proactive control. Entuity seamlessly integrates with existing ITSM and internal communications platforms.
Entuity Software™ Platform Overview
Unify visibility across complex estates without compromising support.

Monitoring
A comprehensive infrastructure monitoring solution for networks, servers, storage, and cloud environments.
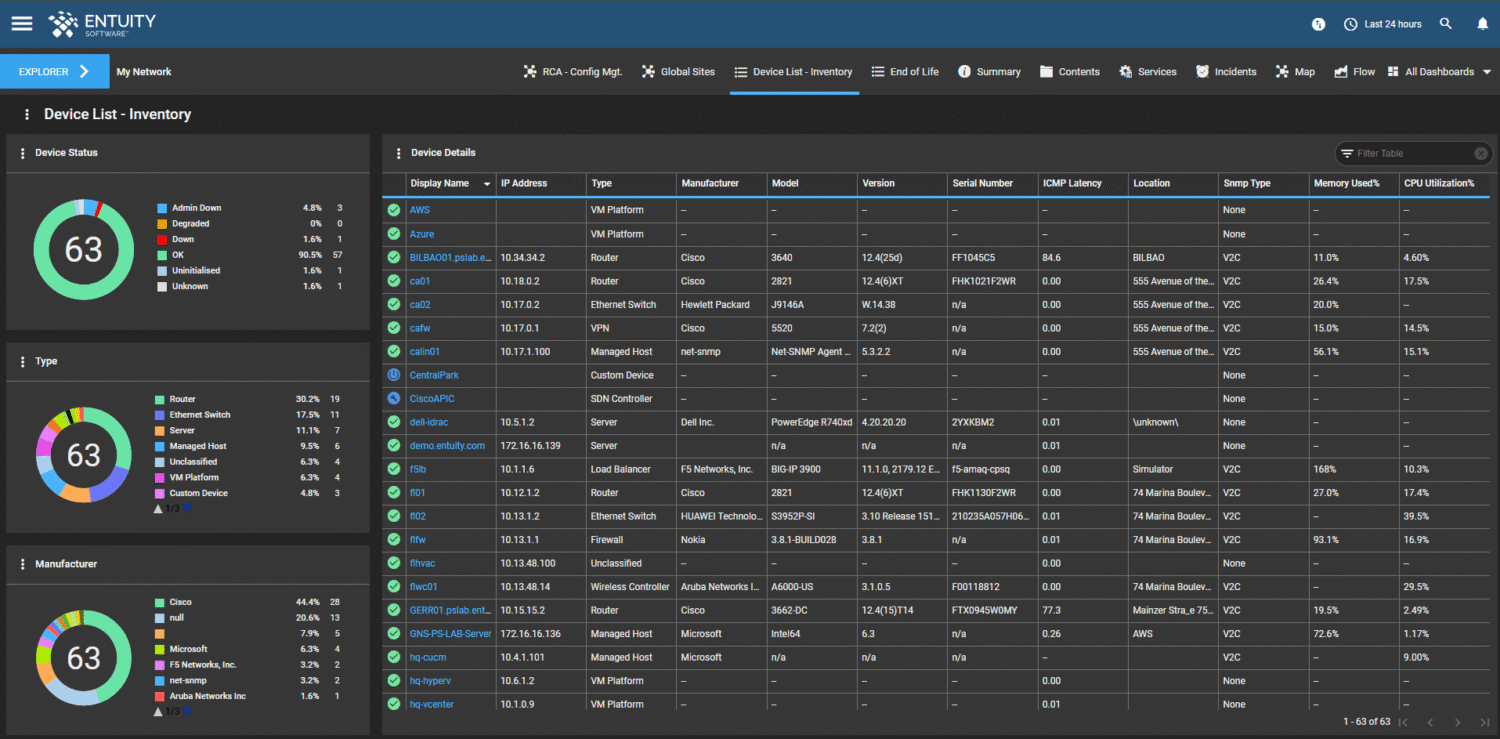
Support for a wide range of devices and technologies from various vendors, including Cisco, Palo Alto, Juniper, HP, Dell, VMware, and Nutanix.
Real-time and historical performance metrics such as CPU, memory, disk space, and port utilization.
Automatically discover and monitor devices, including physical and virtual interfaces without requiring individual configuration for each element.

Visualization
Custom and interactive dashboards to display key performance indicators (KPIs) and operational data relevant to their specific needs or teams.
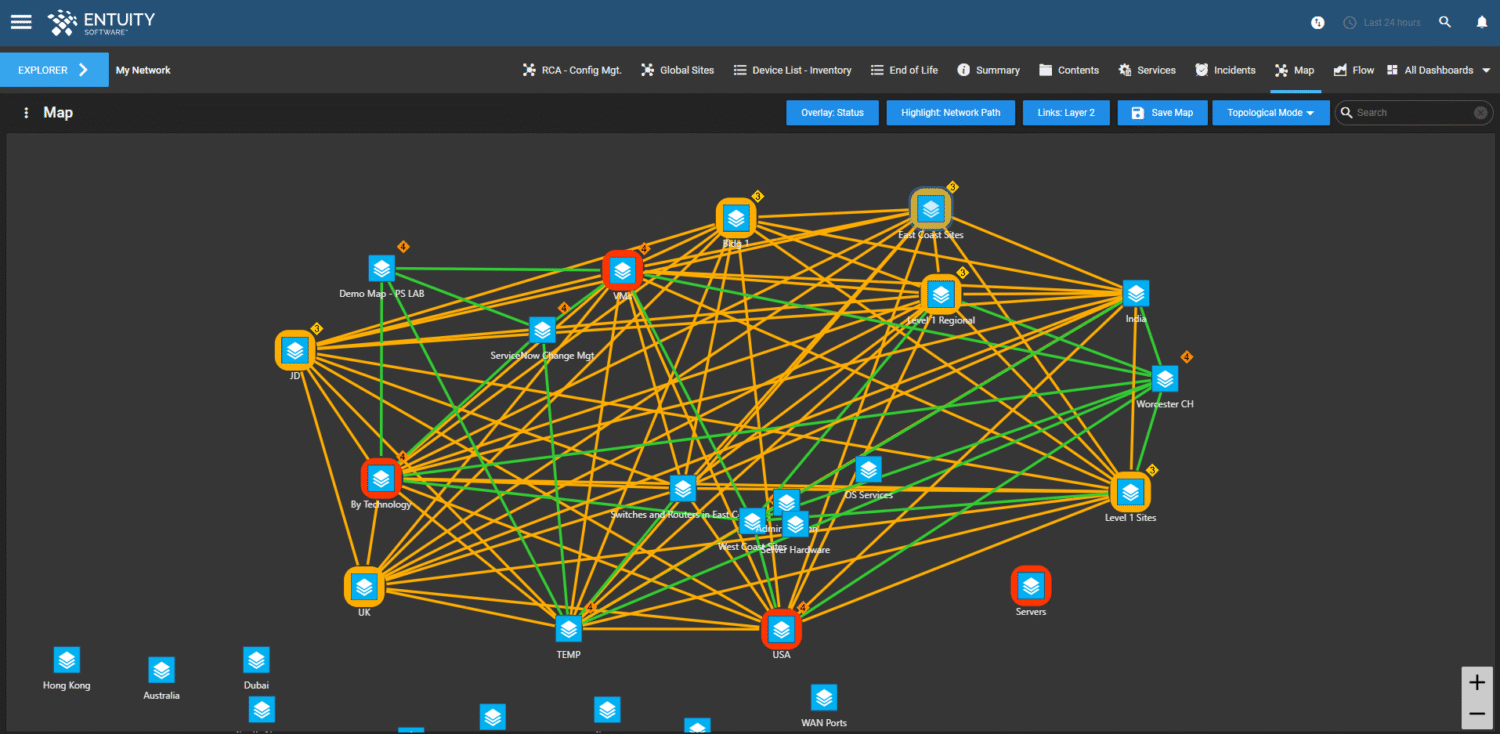
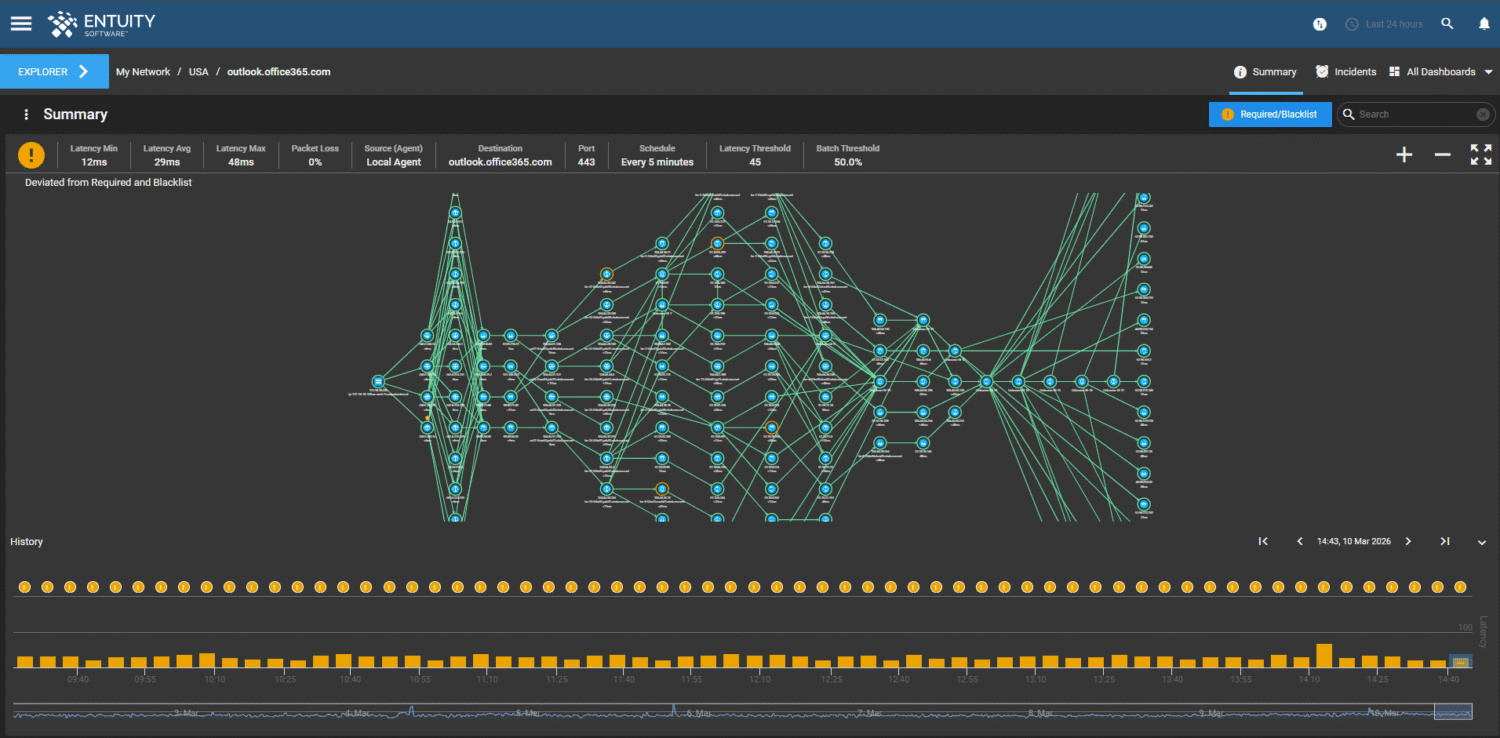
Automated topology mapping that dynamically updates as devices are added or removed from the network.
Integration with Google Maps that allows users to visualize global sites and drill down to specific locations to see device status.
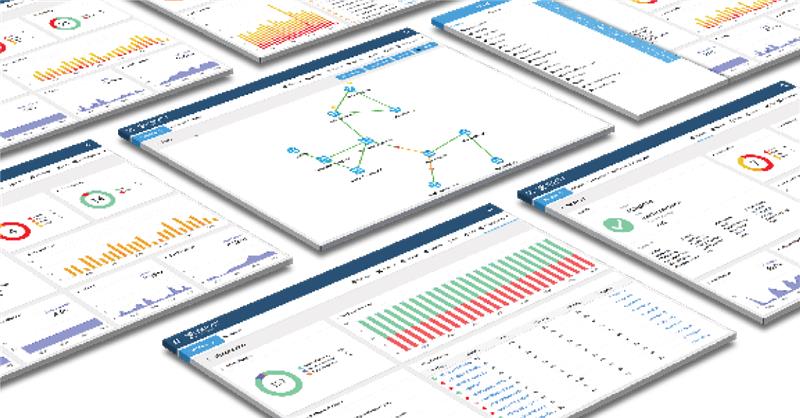
Customized reporting with nearly 100 dashboards included out of the box.

Management
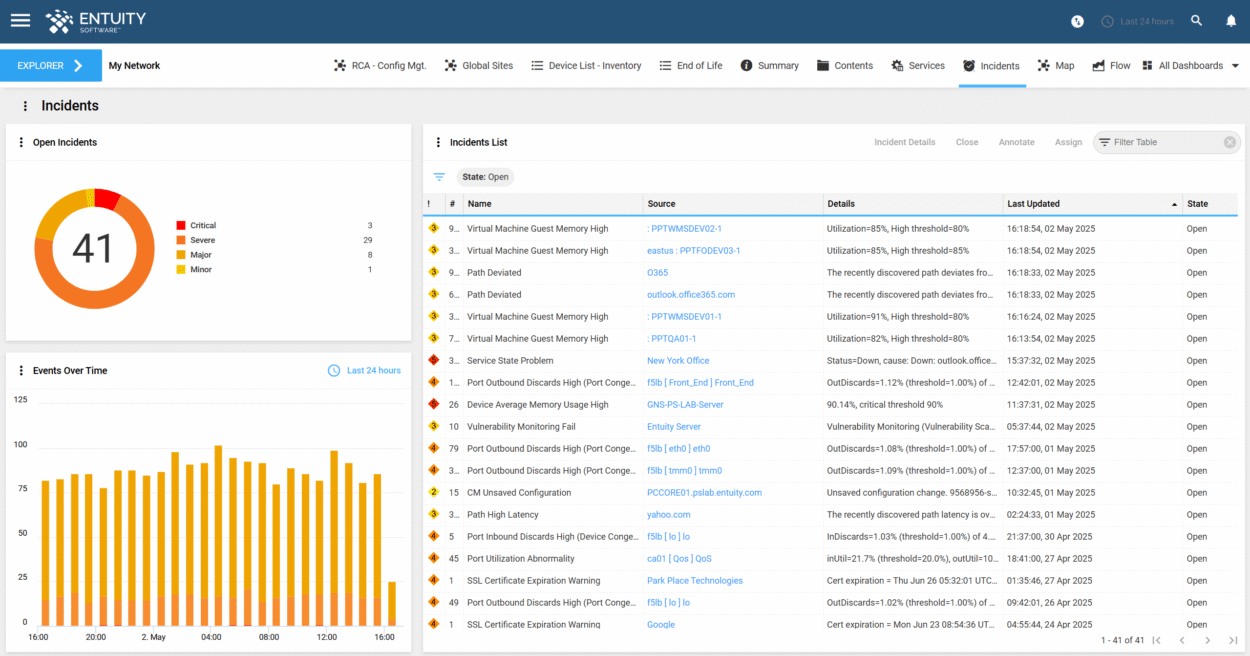
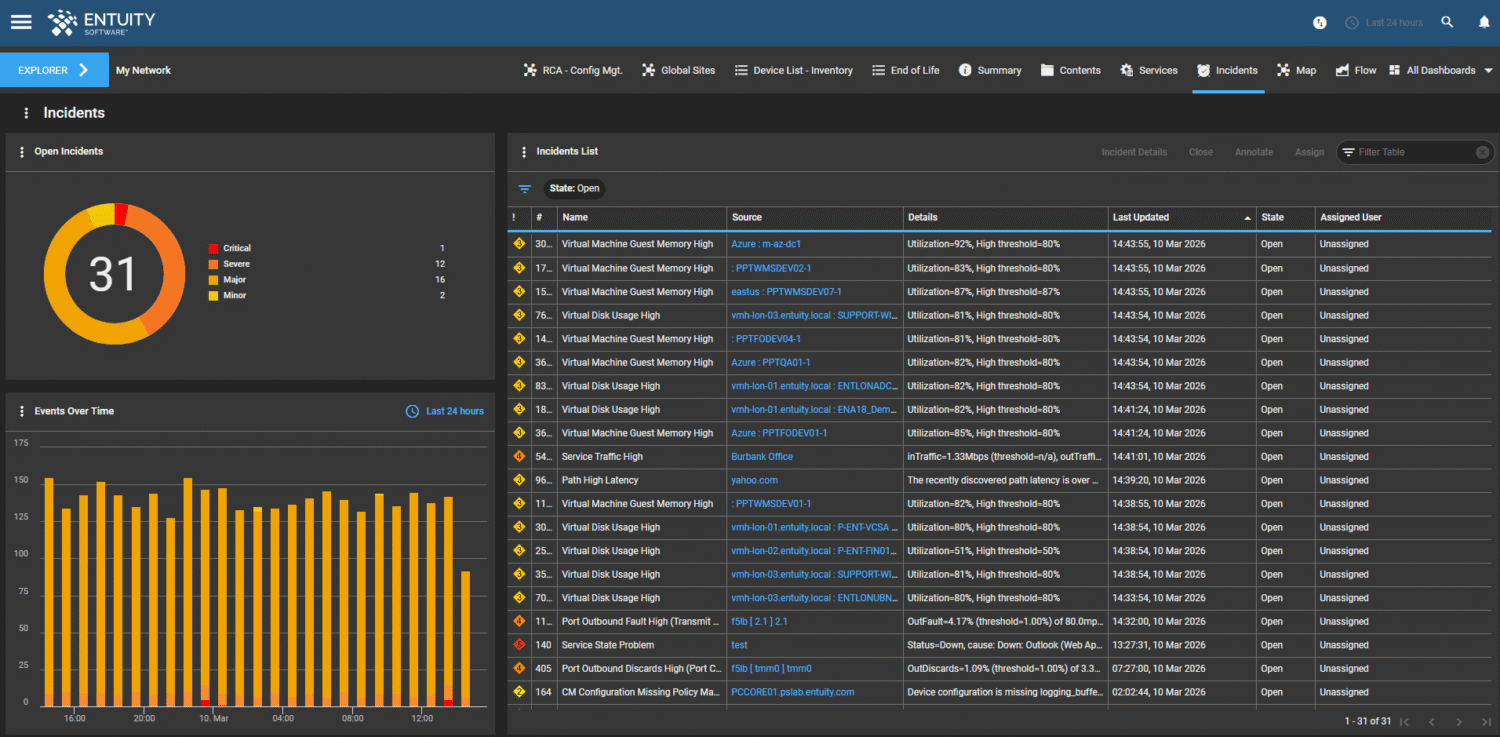
Robust event management and correlation capabilities to reduce alert noise and identify root causes of issues.
Configuration monitoring and management, allowing for automated backups of device configurations, comparison of changes, and the ability to push out configuration changes and firmware updates.
Role-based access control, enabling administrators to set specific permissions for different users or teams.
Integrates with external systems like IT Service Management, the Configuration Management Database, ServiceNow, and Microsoft Teams.
On Demand Product Tour
Designed for today’s complex estates – Entuity empowers ITOps teams to effectively monitor, visualize, and manage their infrastructure. See how it provides comprehensive visibility across your network, servers, and storage. Discover automated topology mapping, intelligent alerting, and powerful reporting to streamline your IT operations.
Network Monitoring Overview
Learn about the specific features of Entuity that make it a leader in network monitoring.
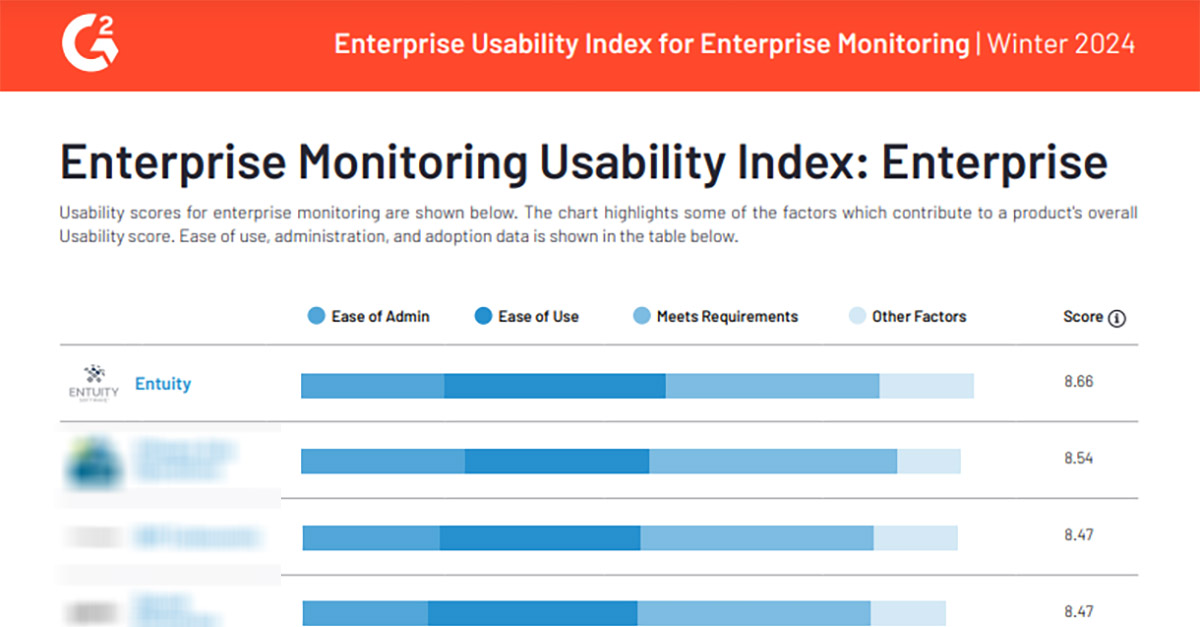
A leader for 17 consecutive quarters.
G2 users rave about Entuity Software™, ranking it a worldwide leader in network and infrastructure monitoring.


Organizations that Depend on Entuity


Customer Testimonials

Ready to Learn More or Schedule a Demo?
Our team of Solutions Sales Executives and Solutions Architects are ready to help you explore how Entuity can increase your visibility and decrease the complexity of managing your estate.
Complete the Form Below to Get Started
Key Capabilities for Network Monitoring
-
Entuity monitors a wide range of network devices, including routers, switches, firewalls, load balancers, and wireless controllers. It also extends its monitoring to servers, virtualization layers (VMware, Hyper-V, AWS, Azure), storage, and hardware.
-
The solution supports thousands of products and models from hundreds of vendors, covering traditional and modern infrastructure, including software-defined services. This means it can monitor diverse environments like Cisco, Arista, Juniper, Palo Alto, and Meraki.
-
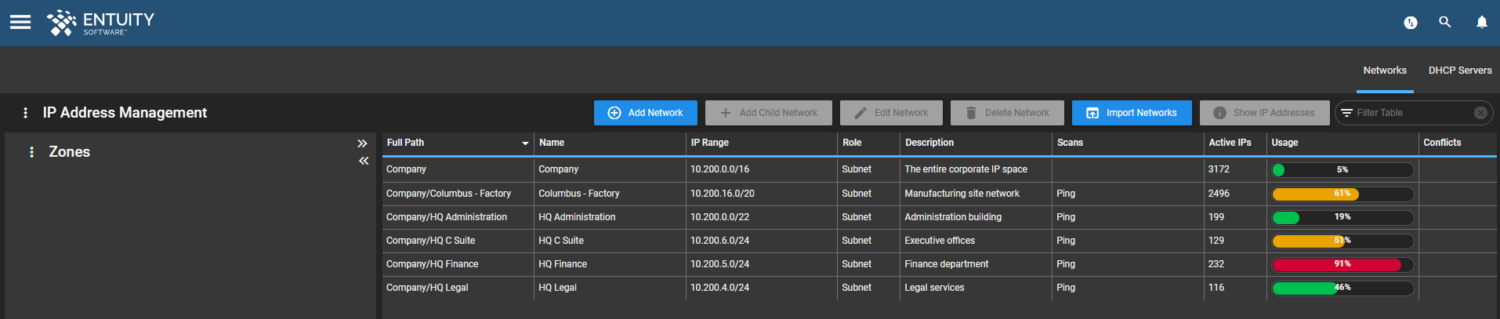
Entuity offers automatic asset discovery and detailed topology mapping scanning IP ranges at regular intervals (down to 1 minute granularity) and automatically updating topology maps to reflect changes in the network. This feature eliminates the need for manual diagramming and updates, saving you time and effort.
-
The system is designed to reduce alert noise by correlating events into actionable incidents.
-
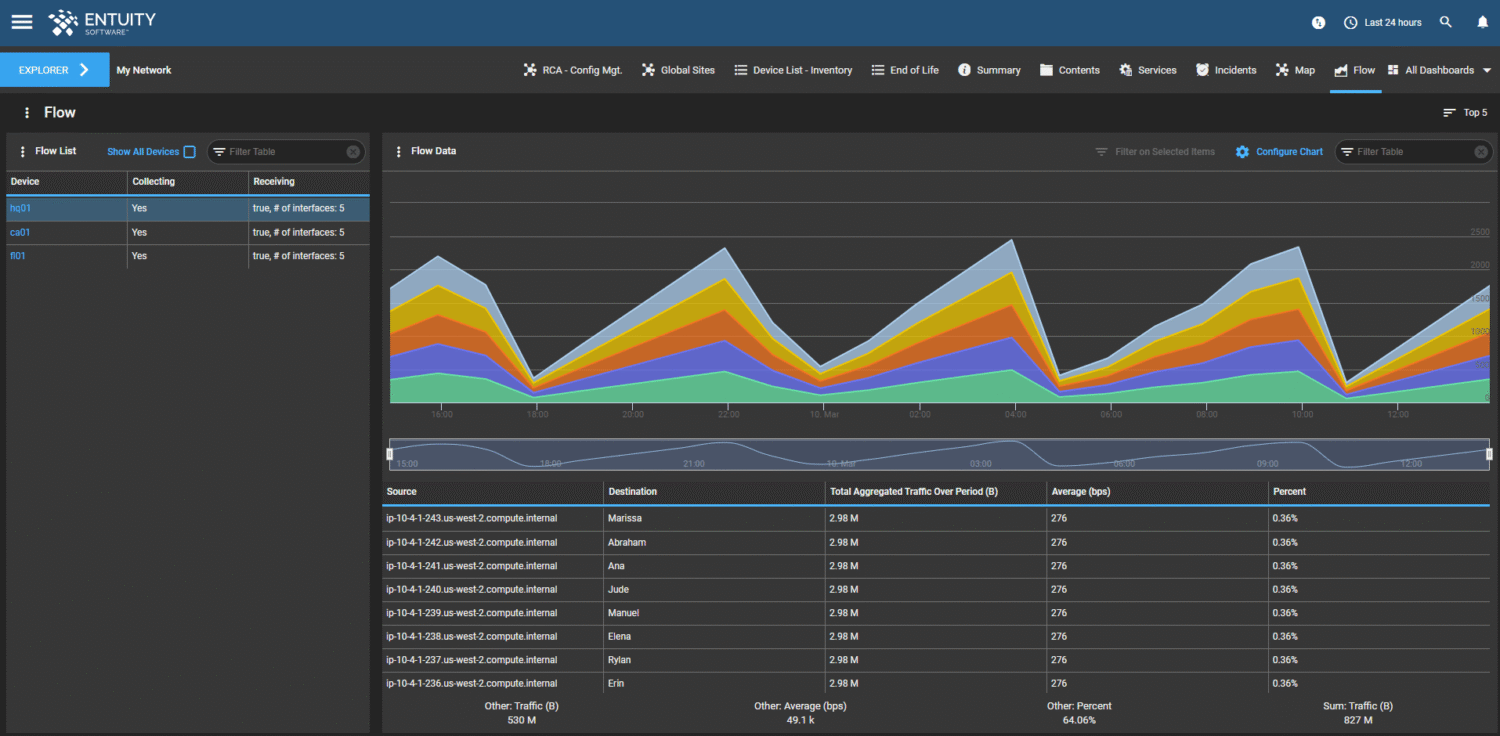
Entuity provides rapid SNMP polling for selected OIDs and immediate processing of incoming SNMP traps, webhooks, and SYSLOG messages. It offers advanced traffic analysis using NetFlow, NBAR data, and interface utilization, enabling the identification of top talkers, applications, and potential bottlenecks. It’s the data you need, the moment you need it.
Featured Resources: White Papers, Case Studies & Blogs


Get Started with Entuity Software™
Ready to see Entuity in action? Monitor, visualize, and manage your estate with ease.