What Is APM? – The Ins and Outs of Application Performance Management
Park Place Professional Services
Table of contents
Why do you need APM? • Key benefits of APM • Understanding traditional APM • How APM is evolving into EUEM
What Is APM?

Why Do You Need APM?
Businesses must understand how applications are performing simply because all human beings today are consuming applications, whether they’re required for internal job roles to enable productivity or the company itself is selling an application to their customers.
- The global software as a service (SaaS) market is expected to grow from $225.6 billion in 2020 to $272.49 billion in 2021 at a compound annual growth rate (CAGR) of 20.8%.
- The market is expected to reach $436.9 billion in 2025 at a CAGR of 12.5%.
- The average small business uses 102 different apps, while each mid-market business uses an average of 137 apps. Enterprises have, on average, 288 different SaaS apps in usage across their organizations.
Consequently, it’s essential to understand application performance so employees can get their jobs done and customers have an uninterrupted, quality user experience.
Key Benefits of APM
Application performance monitoring brings about many benefits, but the key advantages for the purposes of this article can be broken down into visibility into the application stack and simply keeping customers happy.
- Total visibility
APM allows the team members supporting applications to achieve one view of the application stack, making it easier to communicate and identify problems in distributed environments. - Customer satisfaction
Given the universal reliance on software, application performance problems are not an option, whether you’re consuming SaaS, selling SaaS, or both. APM delivers the performance insights necessary to prevent customer dissatisfaction by staying ahead of issues and delivering a delightful end user experience in line with customer expectations.
Understanding Traditional APM
The role of synthetic transactions
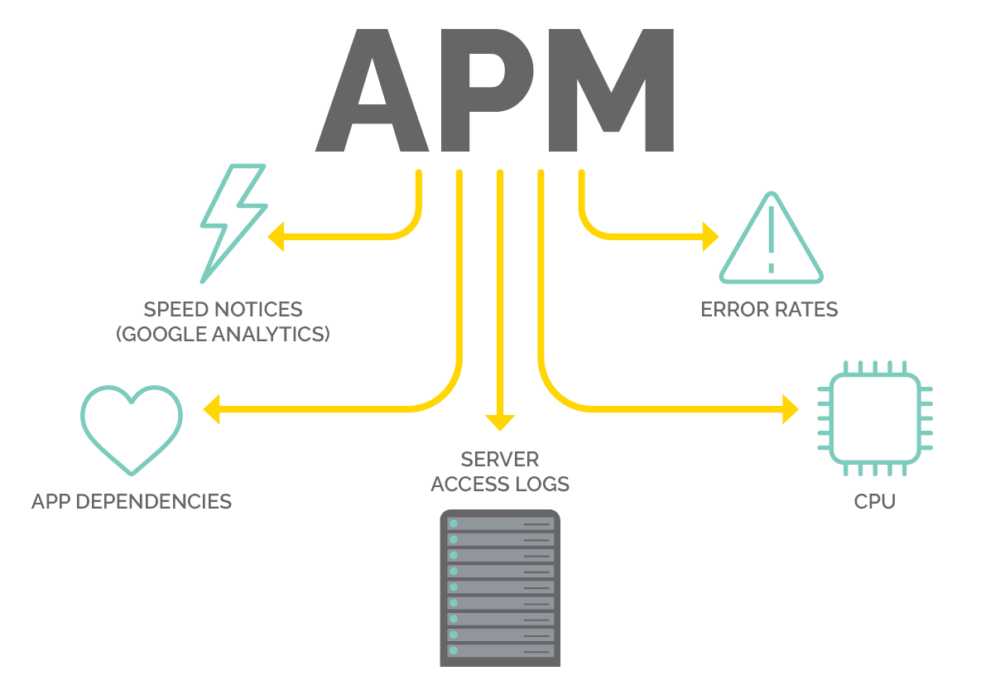
Traditional application monitoring focuses on the health of an application in general. To accomplish this, most application monitoring tools typically use synthetic transactions (also known as synthetic monitoring).
The goal of a synthetic transaction is to establish a baseline for normal performance. Most commonly, synthetic transactions can be automated and run episodically to ensure appropriate performance, but it can also be used for testing software application updates in advance of deployment.
- For example: Imagine yourself and two team members use a web application consistently, such as Zoom for instance, and wish for the experience to be positive. To monitor Zoom, you decide to create a fourth user to send application traffic to Zoom servers (a synthetic transaction). Based on how long the traffic takes to reach the target, latency, jitter, and how long it takes to load when it gets to the other end, your team can produce a basic extrapolation of the overall health of Zoom and apply it to your users. You might think to yourselves, “According to our synthetic transactions, our Zoom application is very well. Based on this, we can assume the other Zoom users are having a similar experience.”
The Two Types of Traditional Application Monitoring
Traditional application monitoring can be broken down into two different types for all intents and purposes: APM focused on the general health of an application, and advanced APM which provides extensive metrics on the health of an application down to the code level. Though the industry doesn’t officially distinguish these approaches, it’s helpful to know the difference.
1. APM Focused on General Application Health
Most applications today offer different performance metrics, such as Microsoft, who offers an extensive restful API interface for every product. These APIs provide data about the health of the applications, allowing you to measure application performance. Since the metrics are available via rest API, it is possible to query this data the same way you would query standard network data such as SNMP. Once the application provides the data, you can put it into dashboards, charts, widgets, etc. to tell a story about its performance. Typically, APM providers who use this approach will offer hundreds or even thousands of application templates with dashboards, allowing users to install templates from a library, choose what to monitor, and simply wait for the tool to collect the data from the API for their product of choice.
2. Advanced APM
This type of application performance monitoring takes an extensive, exhaustive, and more complex approach into determining the health of an application right down to the application component and the code it’s comprised of. Most often, the users of advanced APM solutions are software development companies who need to know the health of their code continuously.

For example: Imagine a CRM software company wishes to use an advanced application performance monitor to watch their CRM and ensure they can identify application problems prevent service disruption for customers. The advanced application performance monitor will evaluate detailed transactions such as each time a customer clicks on a button in in the CRM, which will trigger a code request. The button could be, for instance, sending a code request to a database asking for a specific user ID. The tool will track and trace that transaction at code level (a process known as transaction tracing) from every interaction within the product, which is very different from monitoring database transactions. If a CRM user were to press a button with no outcome, the advanced APM solution will trace exactly what happened and evaluate every piece of code, including where it was interacting with other code outside that particular function.
As we all know, many applications today (like CRMs) use a microservice architecture rather than a monolithic application instance, effectively splitting parts of the application up between different scalable servers. An advanced APM tool will also monitor whether bottlenecks in database transactions exist, which demonstrates one of the main reasons this type of application monitoring is so important. Every time a user takes an action in an application, the code will contact different application servers to get the information it needs for the user to complete the task within the user interface. All those transactions must be traced in case anything goes wrong, such as breakages, a nonresponsive database, a nonresponsive server, etc., allowing software developers to pinpoint exactly where the problem exists (in a very complex mass of connections) so it can be fixed as fast as possible. Advanced APM tools are an excellent option for software development companies who maintain their own code and use it to roll out services to customers continuously, as it provides incredibly granular details for identifying issues and ensuring that business transactions take place smoothly and successfully.
Learn how our network path monitoring software, SurePath, can be used to see exactly how an application path travels through your network.
How APM Is Evolving into EUEM
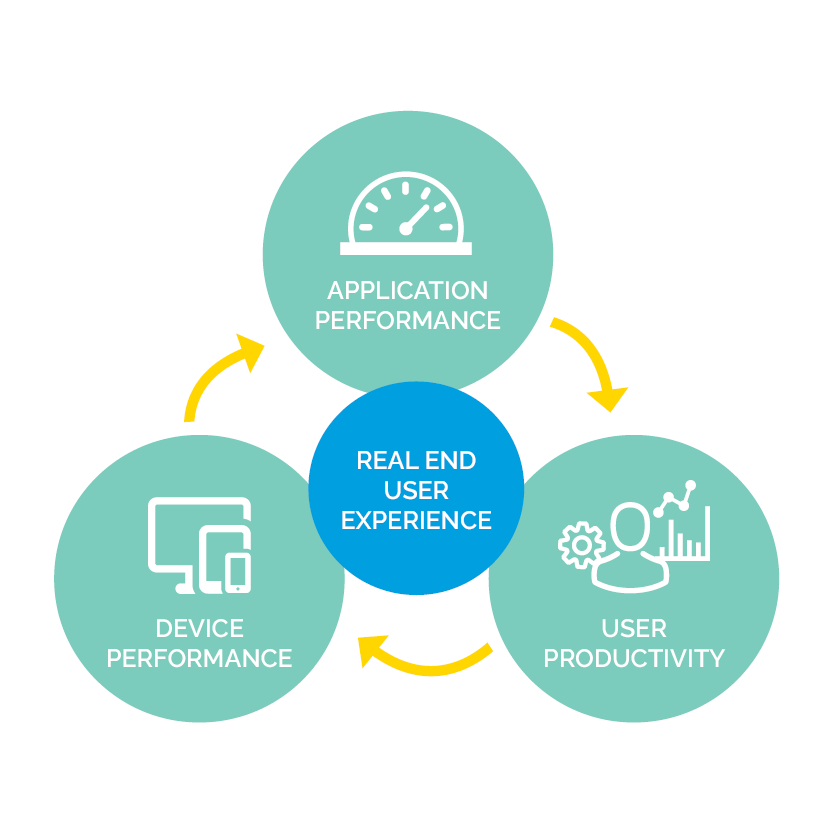
APM is experiencing an evolution. Today, it’s morphing into what the industry refers to as end user experience monitoring (EUEM).

Historically, network monitoring tools have focused more so on the performance of individual infrastructure components. EUEM tools are aimed at the complete IT stack.
- For example: Let’s return to the Zoom scenario. In the case of user experience monitoring, your team would install an agent onto each members’ laptop, which will constantly monitor every application in use, Zoom included. Therefore, it would monitor the performance of Zoom from your perspective, as well as your two colleagues’. This is significant because, particularly post-COVID, your team is possibly geographically dispersed, and almost certainly using different hardware on your laptops – all of which contribute to your unique experience using Zoom, and the unique experience of your team members who are also using Zoom. EUEM is in the earlier stages of development, but it’s reasonable to expect that it will become the standard for application monitoring in the coming years.


